
Septic System Risk Assessment
Lake Sunapee Protective Association (LSPA) hired FB Environmental (FBE) through a Local Source Water Protection Grant from NHDES, and with support from the US Environmental Protection Agency, to start a Septic System Vulnerability Assessment for an area around Mountainview Lake.
This mapping and data inventory tool helped visualize areas where wastewater pollution from a potential failed septic system in that area was most likely to occur, or where it would do the most damage if it occurred.

The analysis first combines several environmental datasets (soils, wetlands, surface waters, and flood zones) to understand where the landscape is naturally more or less vulnerable to septic system impacts if they were to fail.
This project helps LSPA and watershed towns:
Identify areas where septic systems may be at higher vulnerability
Prioritize outreach to landowners
Support long-term watershed planning and protection
Target areas where future funding or assistance will have the greatest benefit
After this pilot project with FBE, LSPA staff took on the challenge of mapping and analyzing the rest of the watershed.
Read the full report here, or view the final presentation from FBE here.
Read the project overview poster here.
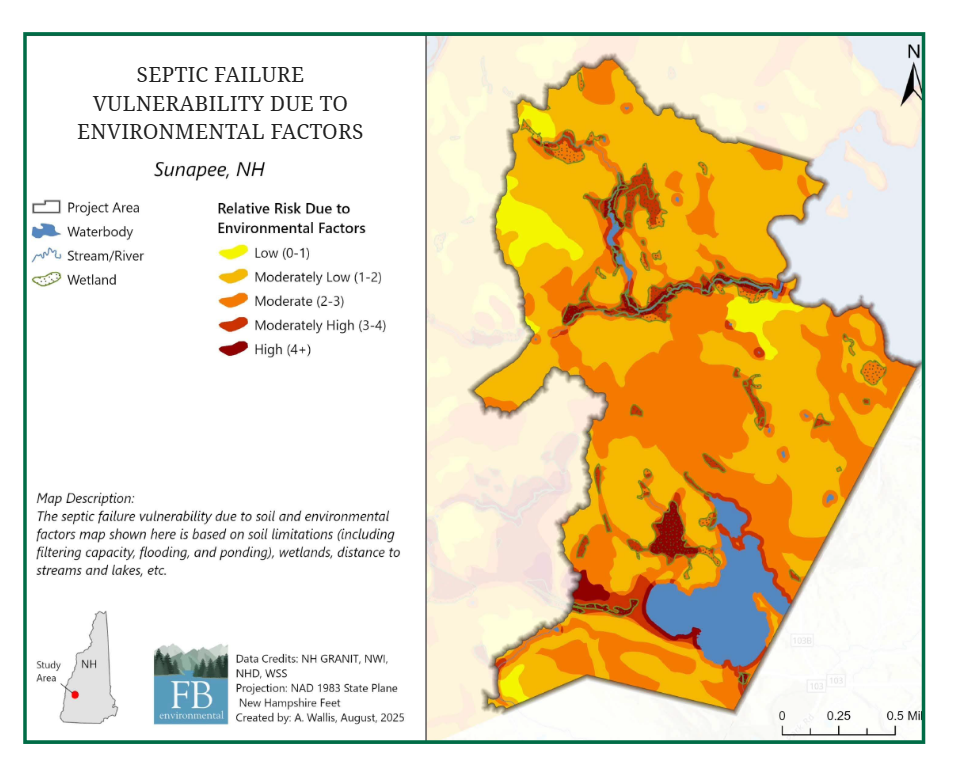
Map 1/3: Environmental Vulnerability Based on
Factors in the Landscape
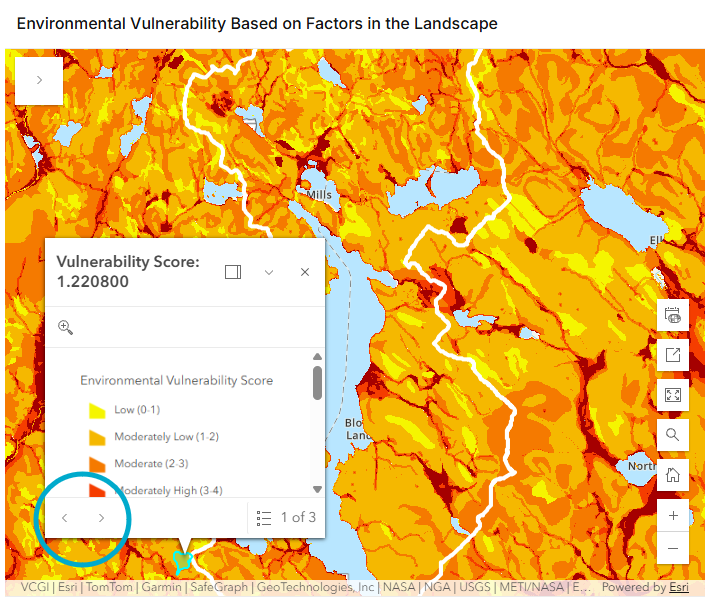
This map was created to visualize the vulnerability of the landscape for Merrimack and Sullivan Counties based on the presence of various environmental factors.
The factors composing this map are based on:
Soil limitations (for a breakdown of the soil characteristics included and why they were prioritized in this analysis, read Appendix A here.)
The presence of wetlands
The presence of highly transmissive aquifers
The presence of flood zones
The distance to streams and lakes
Overlapping factors indicate a greater vulnerability to health and safety should a septic system fail or malfunction there, because the resulting waste will have a more direct route to nearby waterbodies and swimming areas.
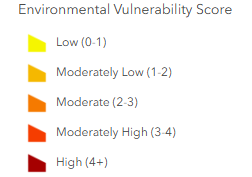
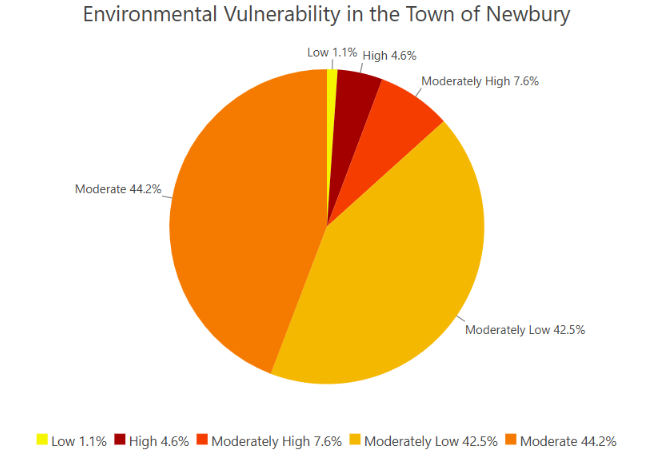
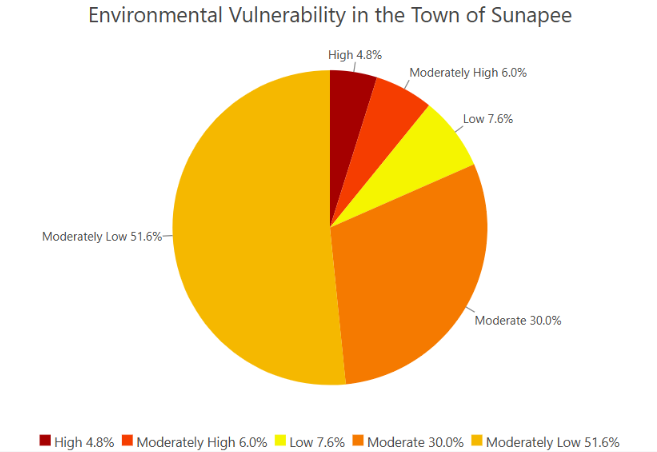
The total vulnerability scores were binned into categories of low (scores 0-1), moderately low (1-2), moderate (2-3), moderately high (3-4), and high (4+) risk.
Tips for using the map on the left!
The top left corner arrow opens the map details, the legend, and the basemap gallery.
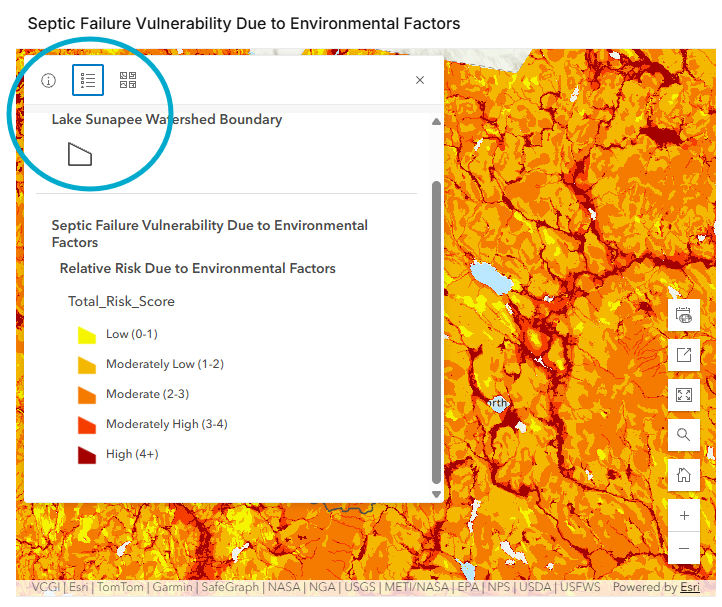
The bottom right tools allow you to navigate the web map here on our website. Hover over each icon to see what they do.
We recommend clicking the second icon from the top to Open in Map Viewer for full exploration of the map and layers.
You can zoom in and out with your mouse’s scroll wheel, and click on the polygons to see what that polygon was ranked.
Click on a polygon to see the total risk score listed at the top of the pop-up box. (see below)
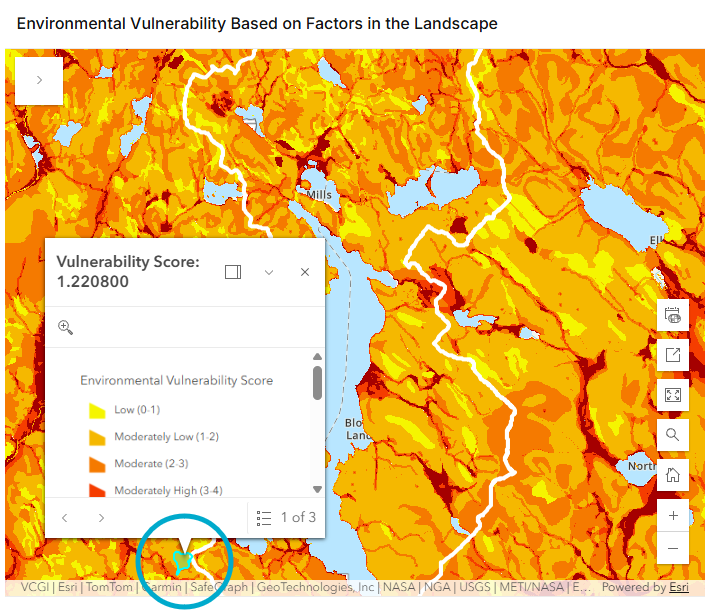
There are often many small polygons next to each other or overlapping each other. When you click on the map, toggle between the layers in the bottom left of the pop-up window.
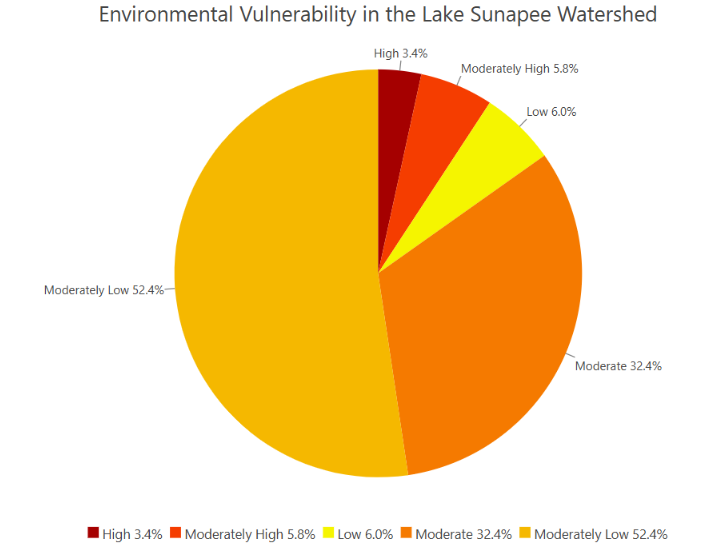
Across the Lake Sunapee Watershed, most of the land we all share falls into lower-vulnerability scores for water quality impacts.
Moderately Low vulnerability covers over half the watershed (52.4%), and together with Moderate vulnerability (32.4%), these two categories account for nearly 85% of the area.
The remaining area is split across:
Low vulnerability: 6.0%
Moderately High vulnerability: 5.8%
High vulnerability: 3.4%
While high-vulnerability areas make up a small share of the watershed, they represent important opportunities for targeted stewardship. Every acre matters to the health of the waterbodies in the Lake Sunapee Watershed, and understanding where vulnerability is highest helps LSPA and our partners focus resources where they'll do the most good.
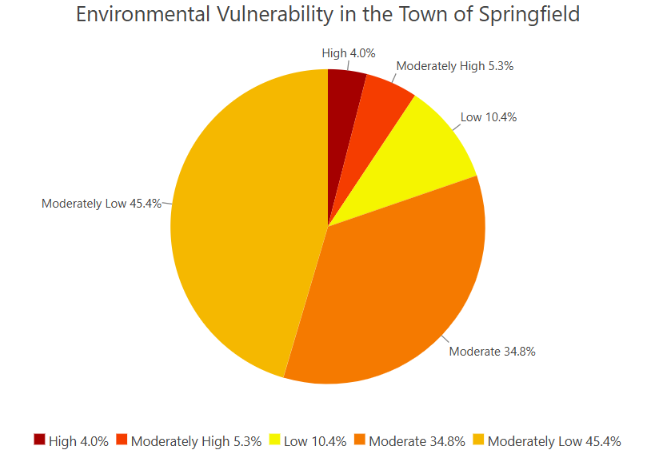
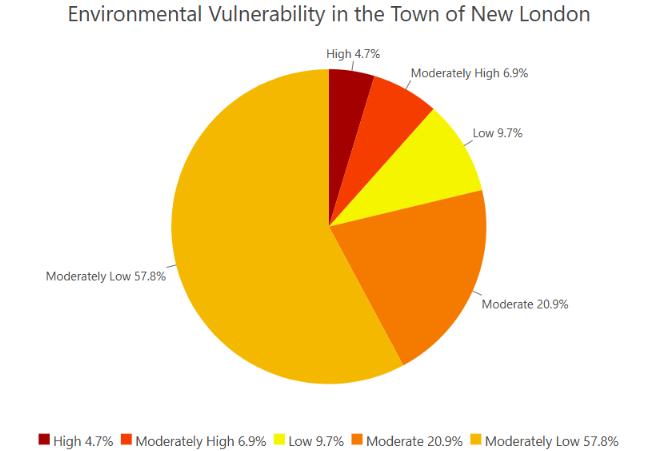
We also calculated the environmental vulnerability scores for the four towns in our watershed (Springfield, New London, Newbury, and Sunapee):
Map 2/3: Parcel-Level Environmental Vulnerability
Based on Factors in the Landscape
This map takes the environmental vulnerability scores from the first map and applies them to individual properties across Merrimack and Sullivan Counties. Each parcel's score is an average of the vulnerability across the whole property, weighted by how much of the parcel each score covers.
Scores are not yet available for some parcels, mostly in Croydon, Langdon, and Danbury, where parcel data is incomplete.
Why look at parcels?
The natural landscape doesn't follow property lines. A single parcel might include several soil types, a patch of wetland, or a corner that falls within a flood zone or aquifer area. That means one property can hold a mix of lower- and higher-vulnerability ground.
Averaging these conditions across each parcel gives a single, comparable score for every property. This helps us see where vulnerable landscapes are concentrated, so LSPA can focus education, outreach, and conservation where they will do the most to protect water quality in the region.
A parcel's score reflects its natural landscape conditions only. It is not an assessment of any property owner, building, or septic system.
In this video showing Map 1 & 2, notice how the assessment of the natural landscape’s vulnerability doesn’t necessarily follow property lines.